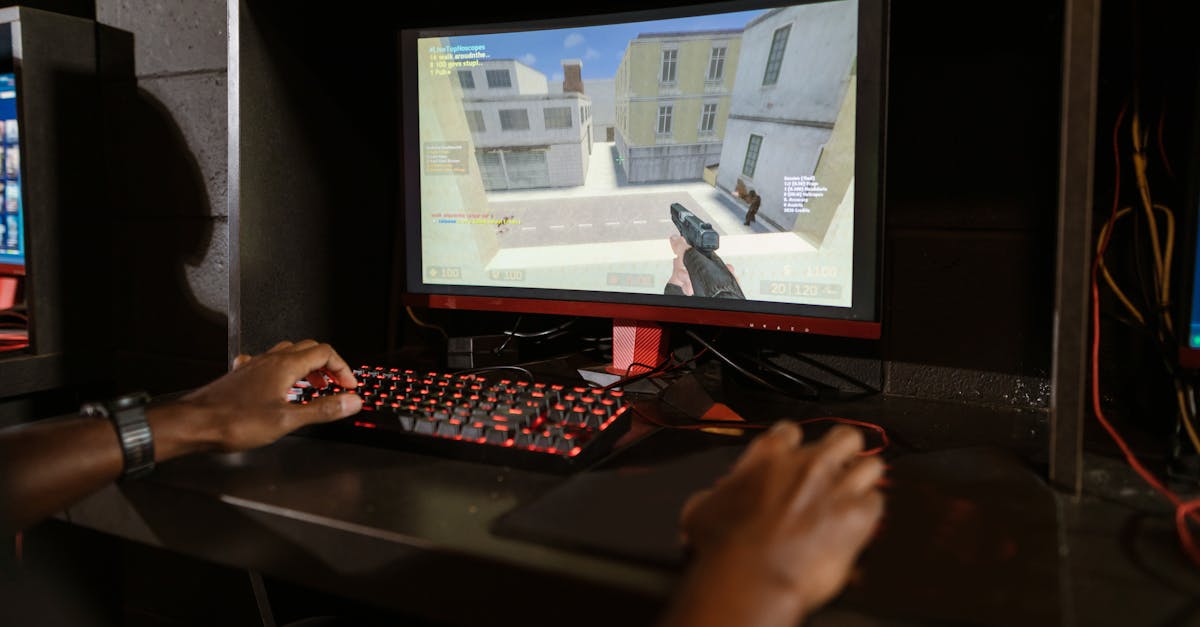
You’re in the middle of a heated firefight or a crucial boss battle, and suddenly, everything feels…off. The game hitches, your inputs lag, and that silky-smooth experience you paid for vanishes. For a long time, I just blamed my internet or an aging GPU. The mistake I see most often is just reacting to these moments, or worse, ignoring them, when a simple tool could give you real data: the FPS counter overlay.
Before I started using a dedicated FPS counter, I was flying blind. I’d tweak settings randomly, hoping for the best, or just accept that some areas in a game were ‘choppy.’ What changed everything for me was realizing that an FPS counter isn’t just a number; it’s a real-time diagnostic tool that tells you exactly how your system is performing. It helps you understand what impact your graphics settings truly have, identify bottlenecks, and even pinpoint when background processes are eating into your frame rate. This guide isn’t about hitting arbitrary numbers; it’s about making informed decisions to maximize your actual gaming experience.
Key Takeaways
- An FPS counter overlay provides real-time data to help you understand game performance, not just a raw number.
- Consistent frame pacing matters more than peak FPS for a smooth gaming experience.
- Integrate FPS monitoring into your graphics settings adjustments for data-driven optimization.
- GPU usage, CPU usage, and frame time variations are more informative than FPS alone.
Why Frame Pacing Beats Raw FPS for Smooth Gameplay
Most gamers focus purely on the frames per second (FPS) number displayed on their screen. While a higher average FPS is generally good, it doesn’t tell the whole story. In my experience, consistent frame pacing is far more crucial for a truly smooth and enjoyable gaming experience than simply hitting a high FPS number.
Think about it this way: if your game is reporting an average of 90 FPS, but one frame takes 5ms to render and the next takes 25ms, you’re going to feel those inconsistencies. That’s a ‘stutter,’ even if your average FPS looks respectable. A frame pacing issue means that the time between each frame appearing on your screen varies wildly, leading to noticeable hitches and a choppy feel. Conversely, a game running at a consistent 60 FPS with excellent frame pacing can feel significantly smoother and more responsive than one averaging 90 FPS with erratic pacing.
What I learned was to look beyond just the average FPS. Many advanced overlays, like MSI Afterburner (which I’ll detail later), don’t just show FPS; they show frame time graphs. When I first saw these graphs, it was an eye-opener. A jagged, spiky line indicates poor frame pacing, while a flatter, more consistent line means smooth delivery. My goal shifted from ‘higher FPS’ to ‘smoother frame time graphs.’ When you’re troubleshooting performance, pay attention to these micro-stutters and sudden dips that a simple average FPS number might mask. It often points to background processes, driver issues, or even specific in-game areas stressing your system unevenly.
Choosing and Setting Up Your FPS Counter Overlay
There’s a surprising variety of FPS counter overlays available, each with its own strengths. From my hands-on testing, the best choice depends on what level of detail you need and how integrated you want it to be. For most gamers, an overlay that provides more than just FPS – ideally including CPU/GPU usage and frame time – offers the most value.
Here are the top options I’ve used:
- NVIDIA GeForce Experience: If you have an NVIDIA GPU, this is the simplest option. It’s built right into your drivers. Open GeForce Experience, go to ‘Settings,’ then ‘HUD Layout.’ Under ‘Performance,’ you can choose where the FPS counter appears. It’s minimalist, easy to enable, and requires no extra downloads. The downside is that it’s basic, showing only FPS, and sometimes GPU utilization if you enable it, but lacks detailed frame time graphs or CPU core breakdown.
- AMD Radeon Software: Similar to NVIDIA, AMD’s Adrenalin Software offers a native overlay. Open Radeon Software, go to ‘Performance,’ then ‘Metrics.’ You can select which metrics to display, including FPS, GPU utilization, and VRAM usage. It’s a solid, straightforward option for AMD users, providing a bit more info than GeForce Experience, but still not as comprehensive as third-party tools.
- MSI Afterburner with RivaTuner Statistics Server (RTSS): This is my go-to recommendation for anyone serious about monitoring. It’s free, works with both NVIDIA and AMD GPUs, and offers unparalleled customization. After installing MSI Afterburner, you’ll also install RTSS, which is the actual overlay engine. In Afterburner, go to ‘Settings’ (gear icon) -> ‘Monitoring’ tab. Here, you can select dozens of metrics (GPU usage, core clock, memory clock, CPU usage per core, RAM usage, frame time, etc.) and check ‘Show in On-Screen Display’ for each. You can customize text size, color, and position in RTSS. This gives you granular control, allowing you to see exactly which component is bottlenecking your performance. For instance, I once realized my CPU was hitting 100% usage in a specific game while my GPU was barely sweating, indicating a CPU bottleneck I wouldn’t have caught with just an FPS number.
- Steam’s Built-in FPS Counter: For games launched through Steam, there’s a quick, no-frills option. Go to ‘Steam’ (top left) -> ‘Settings’ -> ‘In-Game.’ You’ll find ‘In-game FPS counter’ with a dropdown to select its corner. It’s super light on resources but, like GeForce Experience, only shows FPS.
My advice for setup: Start simple with a native GPU or Steam overlay to get a feel for it. If you find yourself consistently tweaking settings or noticing performance issues, graduate to MSI Afterburner/RTSS. The initial setup might take 10-15 minutes, but the insights it provides are invaluable for optimizing your gaming rig.
Using FPS Data to Optimize Your Graphics Settings
Having an FPS counter running is only half the battle; the real benefit comes from actively using that data to make informed decisions about your game’s graphics settings. Blindly maxing out settings or dropping them all to low is inefficient. Here’s how I integrate FPS monitoring into my optimization process:
Establish a Baseline: Before changing anything, play your game for 10-15 minutes in a typical scenario (e.g., a busy open-world area, a intense combat zone). Note your average FPS, minimum FPS, and, if using a detailed overlay, your frame times. This is your starting point.
Identify Bottlenecks: This is where the more advanced overlays like MSI Afterburner shine. Monitor your GPU Usage, CPU Usage, and VRAM Usage.
- High GPU Usage (90-100%) with decent FPS: Your GPU is working hard, and it’s likely the limiting factor. You can either lower demanding GPU-intensive settings (like texture quality, anti-aliasing, shadow quality, or rendering resolution) or upgrade your GPU.
- Low GPU Usage (e.g., 60%) with low FPS, but high CPU Usage (e.g., 90-100% on some cores): This indicates a CPU bottleneck. Your GPU is waiting for the CPU to send it information. Lowering CPU-intensive settings (like crowd density, draw distance, physics details) might help, or it could be time for a CPU upgrade.
- High VRAM Usage (near capacity of your GPU’s VRAM) with stuttering: Lower texture quality. Exceeding VRAM capacity forces your system to use slower system RAM, causing stutters.
Tweak One Setting at a Time: This is critical. Change only one graphics setting, then re-test in the same scenario for a few minutes. Observe the impact on your FPS, minimums, and frame times. Did shadows from ‘Ultra’ to ‘High’ gain you 10 FPS without a noticeable visual difference? Keep it. Did ‘Volumetric Clouds’ from ‘High’ to ‘Medium’ only gain you 2 FPS but make the sky look awful? Revert it.
Prioritize Impactful Settings: In my experience, the biggest FPS gains often come from:
- Resolution Scaling/Render Resolution: Reducing this from 100% (e.g., to 90% or 85%) can yield massive FPS improvements with a surprisingly small visual hit, especially on higher resolution monitors. FSR or DLSS also fall into this category, intelligently upscaling lower-resolution renders.
- Anti-Aliasing: MSAA is a performance hog. TAA is often a good balance, but even turning it off or using lighter options like FXAA can free up significant frames.
- Shadow Quality: Shadows are notoriously demanding. Dropping them from ultra to high or even medium often provides a good FPS boost with acceptable visual fidelity.
- Global Illumination/Ray Tracing: These are cutting-edge effects that look stunning but decimate performance. If you’re struggling, these are the first to adjust or disable.
By systematically adjusting settings and observing real-time feedback, you move beyond guesswork and tailor your game’s visuals to your hardware’s capabilities, finding that ‘sweet spot’ where visual quality meets smooth performance.
Monitoring Frame Time and Understanding Stuttering
As I mentioned earlier, merely looking at the FPS number can be misleading. A consistent 60 FPS is ideal, but even an average of 90 FPS can feel terrible if the frame pacing is off. Understanding and monitoring frame time is the key to diagnosing and eliminating stuttering, micro-stutters, and input lag.
Frame time is the measurement of how long it takes your GPU to render a single frame, usually expressed in milliseconds (ms). If your game is running at 60 FPS, ideally, each frame should take approximately 16.67ms (1000ms / 60 frames = 16.67ms). If you see sudden spikes in frame time (e.g., from 16ms to 30ms or even 50ms for a few frames), that’s a stutter you’re going to feel.
I rely heavily on the frame time graph available in tools like MSI Afterburner/RTSS. When I see a choppy, spiky graph, I know there’s a problem, even if the FPS counter doesn’t drop significantly. Causes for inconsistent frame times can be numerous:
- CPU Spikes: Background applications, shader compilation, or complex scene rendering can suddenly max out a CPU core, causing the GPU to wait.
- Driver Issues: Outdated or corrupted display drivers are frequent culprits. A clean driver reinstallation often works wonders.
- VRAM Overload: If your game is trying to use more video memory than your GPU has, it will swap textures to slower system RAM, causing massive frame time spikes.
- Game Optimizations: Some games are simply not well optimized and will have inherent frame pacing issues, especially in specific areas or during certain effects.
- Background Processes: Antivirus scans, Windows updates, or even browser tabs can introduce micro-stutters. Always close unnecessary applications when gaming.
- Power Delivery Issues: Less common, but insufficient power from your PSU or inconsistent power delivery to your CPU/GPU can lead to instability.
When I notice stuttering, I open my overlay, look at the frame time graph, and check other metrics simultaneously. If a frame time spike coincides with a CPU spike on a specific core, I investigate background processes or CPU-intensive game settings. If it’s a VRAM issue, I lower texture quality. This systematic approach, driven by frame time data, is far more effective than just hoping for the best.
Beyond FPS: GPU and CPU Usage Monitoring
While FPS and frame time are vital, they don’t operate in a vacuum. Comprehensive monitoring involves looking at GPU and CPU usage percentages to understand where your system’s performance bottlenecks truly lie. I’ve found that this holistic view is what separates casual tweaking from real optimization.
Let’s break down what I look for:
GPU Usage (Percentage): This tells you how hard your graphics card is working. In most gaming scenarios, you want your GPU usage to be high, ideally above 90%, especially if you’re aiming for the highest possible frame rates at your chosen settings. If your GPU usage is consistently low (e.g., 50-70%) while your FPS is also low, it strongly suggests a bottleneck somewhere else—most commonly the CPU.
CPU Usage (Percentage - per core/thread): This is where many gamers miss crucial information. A total CPU usage of 40% might seem fine, but if one or two specific cores are hitting 90-100%, that’s a problem. Games often rely heavily on a few primary threads. If these threads are maxed out, your GPU will sit idle waiting for instructions, leading to a CPU bottleneck. I always monitor individual core usage (easily done with MSI Afterburner) to spot this. If I see a core spiking, I consider lowering CPU-intensive settings in-game (like AI count, physics calculations, draw distance, or crowd density) or closing background applications that might be hogging that core.
RAM Usage: While less common for direct bottlenecks in modern systems (unless you have very little RAM, e.g., 8GB), high RAM usage can indicate that your system is constantly swapping data to your slower storage drive (paging file), leading to stutters. This is especially true if you see both RAM and VRAM nearing capacity, as the system tries to manage resources. More RAM (16GB is the sweet spot for most gaming rigs in 2026) or managing background apps can mitigate this.
VRAM Usage: This is the dedicated memory on your graphics card. Modern games with high-resolution textures can quickly eat up VRAM. If your VRAM usage is consistently at or near 100% of your card’s capacity, your system will start using slower system RAM, causing significant stuttering and FPS drops. Lowering texture quality settings is the primary fix here. It’s often the most impactful setting for VRAM-limited GPUs.
By tracking all these metrics simultaneously, you develop a much clearer picture of your system’s overall health and where its limitations lie. This allows for truly targeted optimization, rather than just guessing. For instance, I once realized a game was bottlenecked by a single CPU core, not my GPU, despite my overall CPU usage looking fine. This led me to disable hyper-threading for that specific game, which sometimes helps in CPU-bound scenarios, and saw an immediate improvement in frame stability.
Frequently Asked Questions
What is a good FPS to aim for?
For a smooth gaming experience, 60 FPS is generally considered the minimum target, especially for competitive games. However, anything consistently above 60 FPS up to your monitor’s refresh rate (e.g., 144 FPS for a 144Hz monitor) will provide an increasingly fluid and responsive experience. The ‘best’ FPS is what feels consistently smooth to you without noticeable stuttering or input lag.
Does an FPS counter affect performance?
Most modern FPS counter overlays, especially the simple built-in ones from NVIDIA, AMD, or Steam, have a negligible impact on performance, usually consuming less than 1-2% of your CPU or GPU resources. Advanced overlays like MSI Afterburner with many metrics displayed might have a slightly higher impact, but it’s typically still very small and worth the diagnostic insights they provide.
Why does my FPS fluctuate so much?
Frequent FPS fluctuations indicate inconsistencies in your system’s ability to render frames, often leading to stuttering. Common causes include CPU bottlenecks (a specific core is maxed out), VRAM limitations (game uses more video memory than your GPU has), background processes (antivirus, browser tabs), driver issues, or areas in the game that are poorly optimized and stress your hardware unevenly. Monitoring GPU and CPU usage alongside frame time can help pinpoint the exact cause.
What is frame time and why is it important?
Frame time measures the time it takes for your GPU to render each individual frame, typically in milliseconds (ms). It’s crucial because it reveals frame pacing consistency. A high average FPS (e.g., 90 FPS) with inconsistent frame times (large variations between frames) will feel choppier than a lower, but more consistent, FPS (e.g., 60 FPS). Smooth frame time (a flat graph) ensures a fluid visual experience, even if the raw FPS number isn’t the absolute highest.
How do I permanently display my FPS counter?
For NVIDIA GPUs, open GeForce Experience, go to ‘Settings’ > ‘HUD Layout’ > ‘Performance’ and enable the FPS counter. For AMD GPUs, open Radeon Software, go to ‘Performance’ > ‘Metrics,’ and configure your desired metrics for the overlay. For a more detailed, universal solution, install MSI Afterburner and RivaTuner Statistics Server (RTSS), then configure the ‘Monitoring’ settings in Afterburner to display desired metrics in the RTSS On-Screen Display. Once configured, these will automatically appear in supported games whenever the applications are running.
Conclusion
Moving beyond just the raw FPS number was a turning point for me in understanding and optimizing my gaming setup. The FPS counter overlay, especially when coupled with detailed monitoring of frame times, GPU, and CPU usage, transforms from a simple display into a powerful diagnostic tool. It empowers you to make informed decisions about your graphics settings, identify real bottlenecks, and chase after that truly smooth, stutter-free gaming experience we all crave. Don’t just look at the numbers; understand what they mean, and you’ll unlock a new level of control over your games. Your next step should be to download a comprehensive monitoring tool like MSI Afterburner and spend an hour getting to know what your system is really doing under pressure.